
NYC 311 is the city’s non-emergency service request system: illegal parking, a broken street light, no heat, a noisy neighbor, a damaged tree. The records are published on NYC Open Data with coordinates, so a heatmap of where complaints were filed is easy to build. What a count map cannot tell you is whether one cell is full of parking complaints while the next has reports of a condition that could actually hurt someone. I built jev-311-heatmap to test one way of adding that dimension: use a language model to rate each complaint description against a fixed rubric, then aggregate those ratings onto a projected 500-meter grid next to the plain count.
Status: a research demonstration. It has one published live run (a single day, September 1, 2026) and 32 offline tests. Model accuracy and calibration against real outcomes have not been measured.
Solution
Two Python scripts do the work. download_dataset.py pulls a date-bounded slice of the 311 Service Requests from 2020 to Present dataset. generate_heatmap.py validates that file, optionally scores each distinct complaint description with JEV (a model served over the TypeSafe HTTP API), aggregates everything onto a grid, and writes six layers as interactive HTML (Folium on OpenStreetMap) and 300 DPI PNGs: complaint count, scoring coverage, mean severity, mean safety concern, an answer-ambiguity proxy, and an illustrative composite. A --mode baseline produces only the count layer, with no model, no API key and no invented scores.
Implementation
Step 1: a bounded download from NYC Open Data
The source is the public Socrata endpoint https://data.cityofnewyork.us/resource/erm2-nwe9.json. It needs no key. The downloader requests twelve columns (IDs, dates, agency, complaint type, descriptor, location type, status, borough, latitude, longitude) and never requests addresses, names or free-text resolution descriptions. Three decisions matter more than they look:
- Count first, refuse rather than truncate. A
count(*)query runs before any rows are fetched. Above--max-rows(default 100,000) it stops with an error instead of silently keeping the earliest records, which would bias the map toward early-morning complaints. - Keyset pagination with a tie-breaker. Many records share a timestamp, so pages are ordered by
(created_date, unique_key)and each starts strictly after the last pair seen. - Write to a temp file, then replace. The CSV only replaces the output when complete. A sidecar
.metadata.jsonrecords the query, counts, times and the CSV’s SHA-256.
# download_dataset.py
def cursor_where(base: str, cursor: tuple[str, str] | None) -> str:
    if cursor is None:
        return base
    created, key = map(sql_text, cursor)
    return (
        f"({base}) AND (created_date > {created} OR "
        f"(created_date = {created} AND unique_key > {key}))"
    )
The live API is not an atomic snapshot. A count change during download is flagged in the metadata; a duplicate ID or growth past the budget aborts without publishing a partial file.
Step 2: cleaning, coordinates and the grid
There is no geocoding step. The 311 dataset already carries latitude and longitude for most records, and the pipeline uses those. Records without usable coordinates are dropped and counted, not guessed. read_records() in generate_heatmap.py does the cleaning:
- Only known columns are kept, so pre-existing score columns in a hand-edited CSV are ignored.
- Rows without an ID are dropped and duplicate IDs keep the last occurrence; both are counted.
- Coordinates must be finite and inside a broad NYC bounding box (latitude 40.4 to 41.0, longitude -74.3 to -73.6). This is a quality guard, not a city boundary.
- If the CSV has a download metadata file beside it, its SHA-256 must match, or the run stops.
Every exclusion is written to run_metadata.json. In the published run, 9,903 reports were downloaded, 205 had missing or invalid coordinates, and 9,698 were mapped.
For aggregation, longitude and latitude are projected to UTM zone 18N (EPSG:32618) with pyproj, then floored into square cells. --cell-m 500 means 500 projected meters, not degrees or Web Mercator pixels, so cells are the same physical size across the city.
Step 3: where the model is used, and what it sees
The model has exactly one job: rate a complaint description. It does not see where the complaint was, when it was filed, who filed it, or whether the city closed it. The state sent to the API is built from four fields only:
# generate_heatmap.py
def semantic_state(row: dict[str, Any]) -> dict[str, Any]:
    # Deliberately exclude coordinates, borough, IDs, dates and resolution/status fields.
    # Identical descriptive states get identical cached judgments, wherever they occur.
    return {"source": "Unverified NYC 311 reported condition", "complaint": {
        field: str(row.get(field, "")).strip() for field in STATE_FIELDS
    }}
STATE_FIELDS is complaint_type, descriptor, location_type and agency. A test (test_states_exclude_locations_and_resolution) checks that changing a record’s coordinates, borough or status does not change its state.
Leaving location out has two effects. The rating depends only on the described condition, so the same complaint gets the same score in every neighborhood. And it makes deduplication very effective: identical complaint descriptions share one evaluation. In the published run, 9,698 mapped reports reduced to 634 distinct states, so the run made 634 API calls rather than nearly ten thousand.
Each call asks three questions, all defined in a single editable QUESTIONS dictionary:
severity: a five-level score (0 to 4) with written criteria, from “no adverse condition described” to “an explicitly described immediately dangerous condition with potential for severe physical harm.”safety_concern: a probability that the described condition presents a plausible physical safety or health hazard.category: a choice among infrastructure, sanitation, noise, housing, traffic, environment and other, returned as a probability distribution.
The instructions are deliberately narrow. Each one tells the model to judge the condition “IF IT EXISTS AS DESCRIBED”, not to infer that harm occurred or that the condition is still present, not to invent aggravating factors, and to treat field contents as data rather than instructions.
Step 4: constraining what comes back
Nothing the model returns reaches a map until parse_response() accepts it. The checks are strict and the failure mode is to stop, not to patch:
# generate_heatmap.py
severity, safety, category = (answers[k] for k in ("severity", "safety_concern", "category"))
severity_value = bounded_number(severity.get("score"), "severity.score", 4)
severity_conf = bounded_number(severity.get("confidence"), "severity.confidence")
category_conf = bounded_number(category.get("confidence"), "category.confidence")
probability = bounded_number(safety.get("noul"), "safety_concern.noul")
cat_probs = validate_distribution(category.get("probabilities"), set(CATEGORIES), "category.probabilities")
choice = category.get("choice")
if choice not in CATEGORIES:
    raise ValueError("JEV returned an unknown category.")
if cat_probs[choice] + 0.01 < max(cat_probs.values()):
    raise ValueError("JEV category does not match its probability distribution.")
Numbers must be finite, in range and not booleans. The category distribution must have exactly the seven expected keys and sum to about one; only tiny rounding is renormalized. The response must name its resolved model, and a run mixing two resolved versions is refused. Around that sit the operational guards:
- No fallback scores. A missing key or failed service stops the run. No heuristic, random or zero score is substituted; mocks exist only in the tests, labeled “SYNTHETIC”.
- A hard call budget.
--max-api-calls(default 500) caps HTTP attempts per invocation, retries included, and the script refuses up front if uncached states exceed it. - A content-addressed cache. SQLite entries are keyed by a hash of state, model ID, full rubric and schema version. Changing the rubric or model invalidates them; changing cell size or DPI needs no new inference. Interrupted runs resume.
- Bounded retries. Transient errors (429, 5xx, timeouts) get bounded backoff with
Retry-Afterhandling; authentication and contract errors stop immediately.
Step 5: from per-report answers to map layers
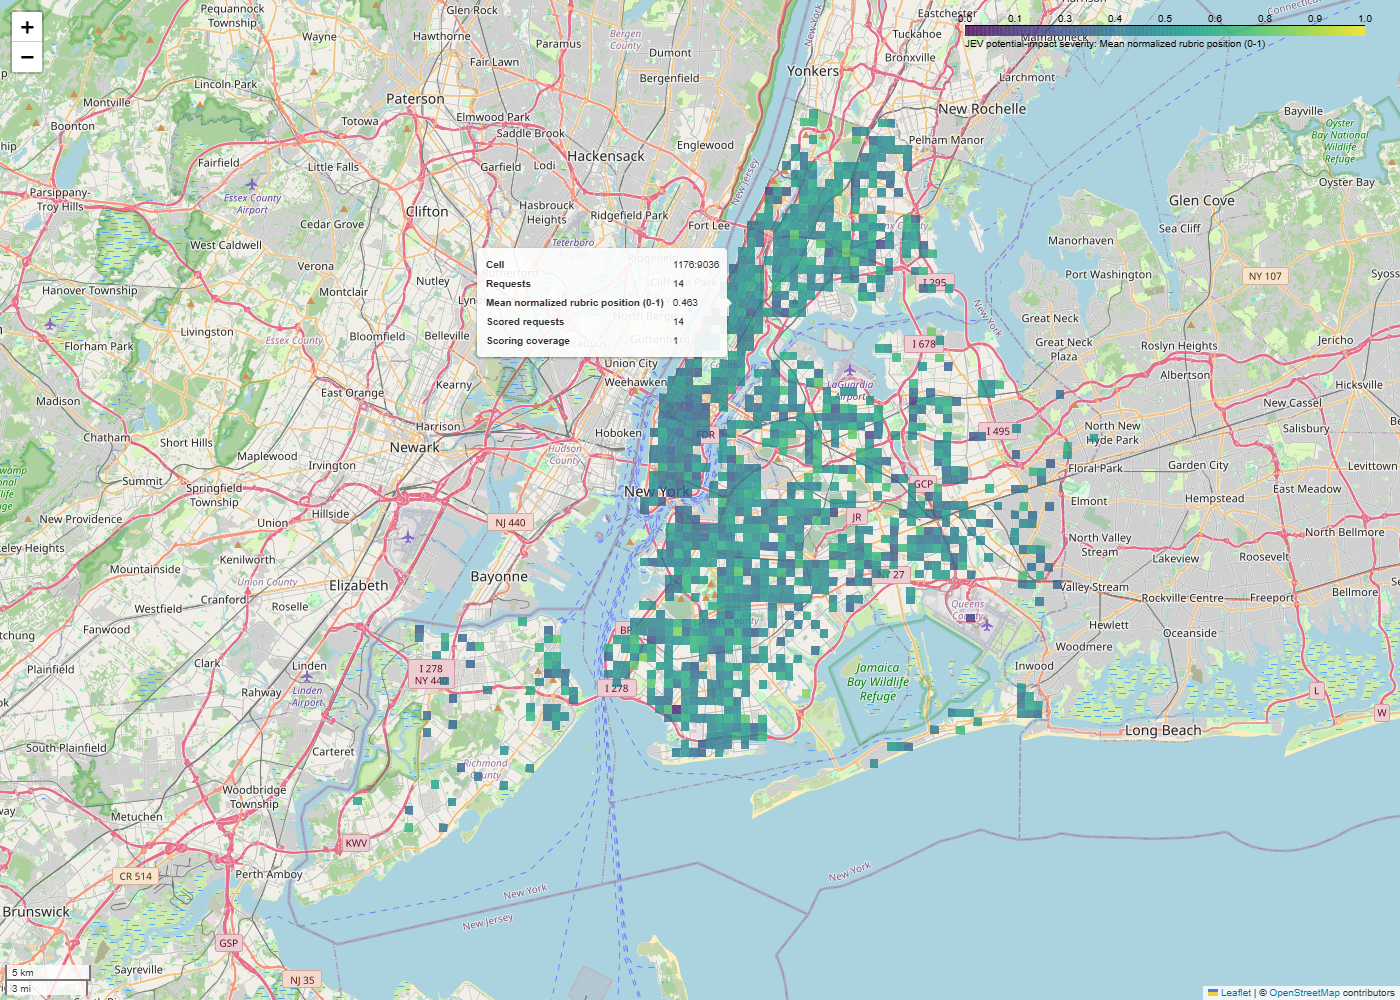
After scoring, each report carries its description’s answers, and aggregate_grid() groups by cell. Severity, safety concern and ambiguity are cell means. The composite is a fixed weighted sum:
# generate_heatmap.py
volume = np.log1p(grid.raw_count) / np.log1p(grid.raw_count.max())
grid["volume_normalized"] = volume
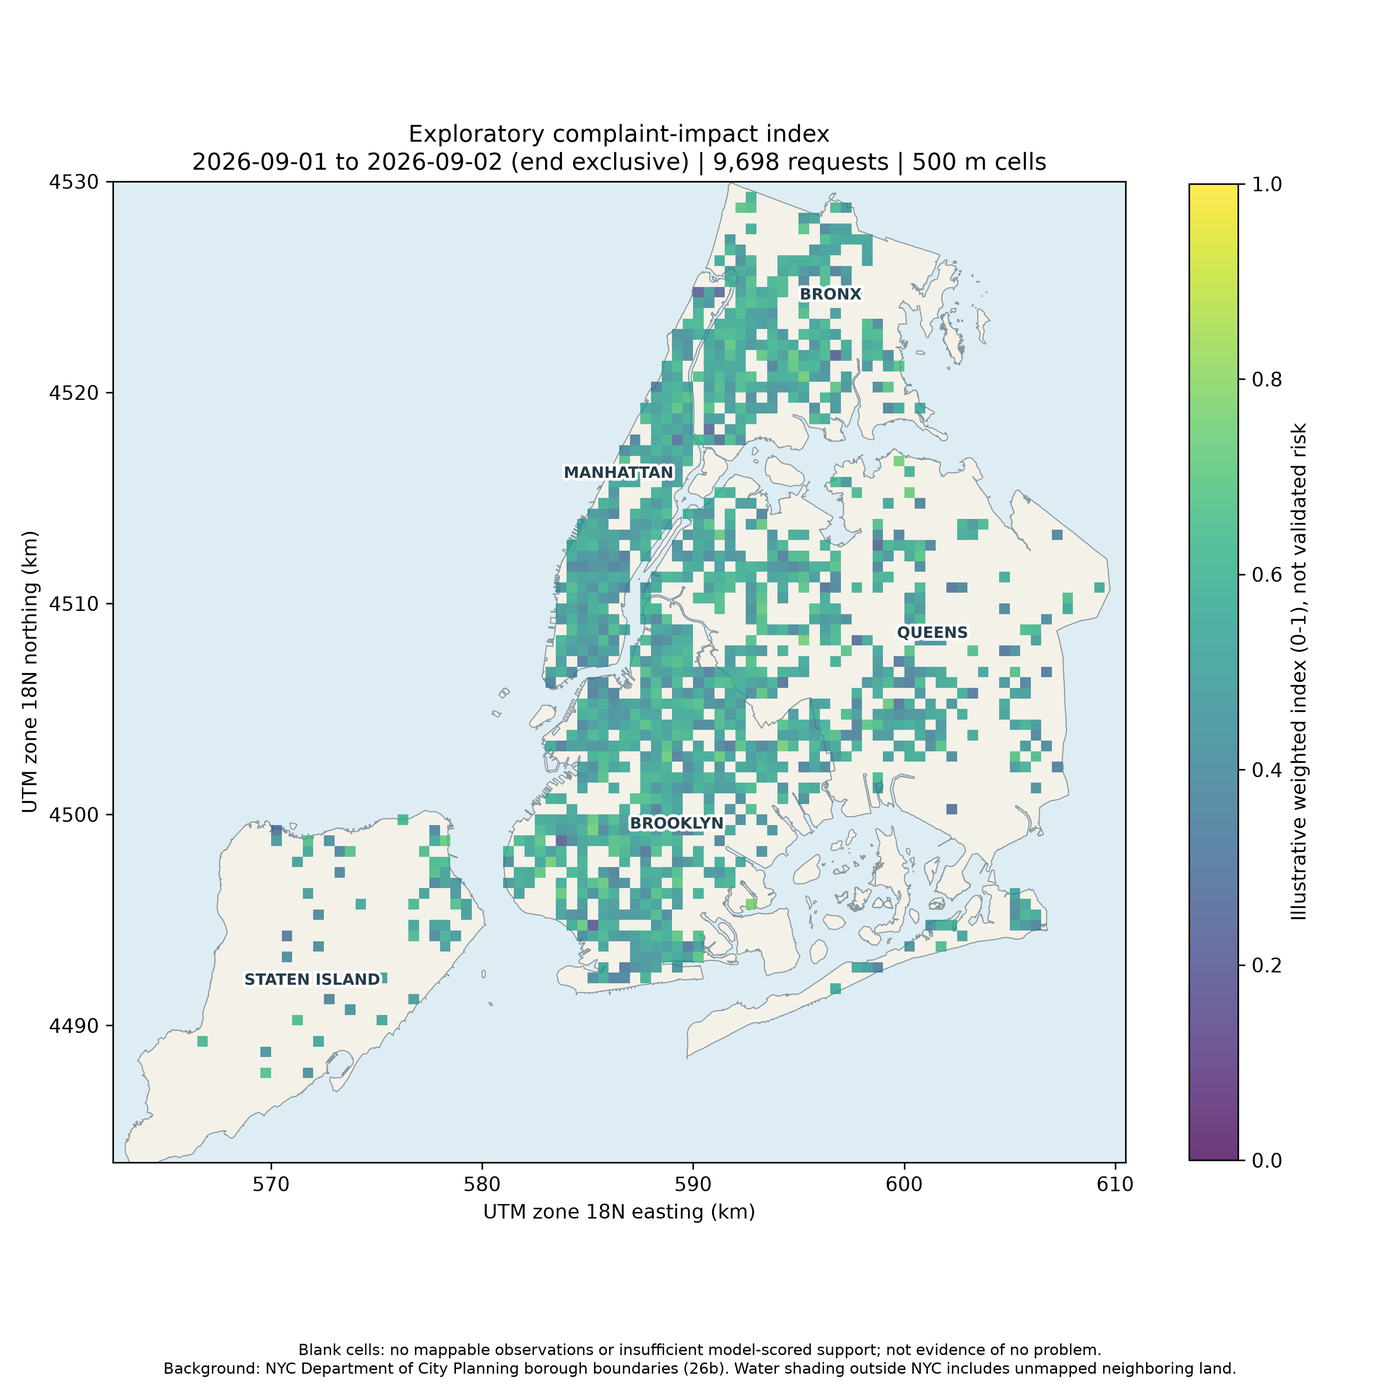
grid["composite"] = 0.50 * grid.severity_mean + 0.30 * grid.safety_mean + 0.20 * volume
The 50/30/20 weights are a design choice, not a fitted model, and the composite’s legend says so (“Illustrative weighted index (0-1), not validated risk”). Volume is normalized against the busiest cell in the current slice, so composites from two separately run slices are not directly comparable.
Sparse cells are handled conservatively. A semantic layer (severity, safety, ambiguity, composite) only shows a cell with at least 3 scored reports and at least 90% scoring coverage. Cells below that are left blank rather than drawn as zero, and every map carries the note that blank cells are not evidence of no problem. The count and coverage layers still show every occupied cell, and the CSV and GeoJSON exports keep all values.
Rendering: static PNGs and interactive maps
Each layer is rendered twice. The PNG uses Matplotlib, one rectangle per cell, UTM-kilometer axes and identical extents across layers so they compare side by side. Bounded metrics use a fixed 0 to 1 scale; only the count layer scales to its maximum. --background-geojson optionally draws borough outlines and labels. The HTML uses Folium: the same cells as GeoJSON over OpenStreetMap, with a legend and tooltips. An index.html repeats the interpretation warnings. Interactive maps need internet access for map assets and tiles and should be served over localhost.
On privacy: the published HTML holds aggregate cell properties only; I searched the committed map files for unique_key, descriptor and complaint_type and found none. The per-request requests_used.csv, which has coordinates, stays local and is ignored by Git. One caveat: the count layer has no minimum-count threshold, so single-report cells are drawn. At 500 meters (about a quarter of a square kilometer) that does not point to a building, but much smaller cells would need suppression before publishing.
Evidence
Maps from the published run
The two maps below come from the live run committed to the repository at commit 172eae5; I captured them from that commit on 2026-10-21.
Validation: what I ran for this article
On 2026-10-21 I cloned the repository at commit 172eae5 into a fresh virtual environment (Windows, Python 3.14.3) and ran:
- The offline test suite:
python -m unittest discover -s tests -vran 32 tests, all passed. They use synthetic records and mocked model responses, and cover pagination, budget refusal, response validation, caching, the missing-key failure, bounded retries, coordinate filtering, sparse-cell suppression and full renders. - A small live download: one day (October 1, 2026) for Staten Island only, with no token. 416 records matched and all 416 were downloaded, with a matching count and hash in the metadata.
- A dry run: 6 records lacked usable coordinates, leaving 410 mappable reports and 162 distinct descriptive states, so a live scoring run would need at least 162 API calls.
- The guards: a JEV run with
--max-api-calls 0stopped with “Need at least 162 API calls … No calls were made.” A JEV run with no key stopped with “Set TYPESAFE_API_KEY for live JEV scoring, or use –mode baseline.” Neither produced output. - A baseline render of the Staten Island slice: 233 occupied cells, one map/PNG pair.
I did not run live model scoring. The severity, safety and composite figures in this post come from the run committed to the repository, which its run_metadata.json records as 634 live evaluations with jev-1.13.0, no retries, and 539,979 reported input tokens.
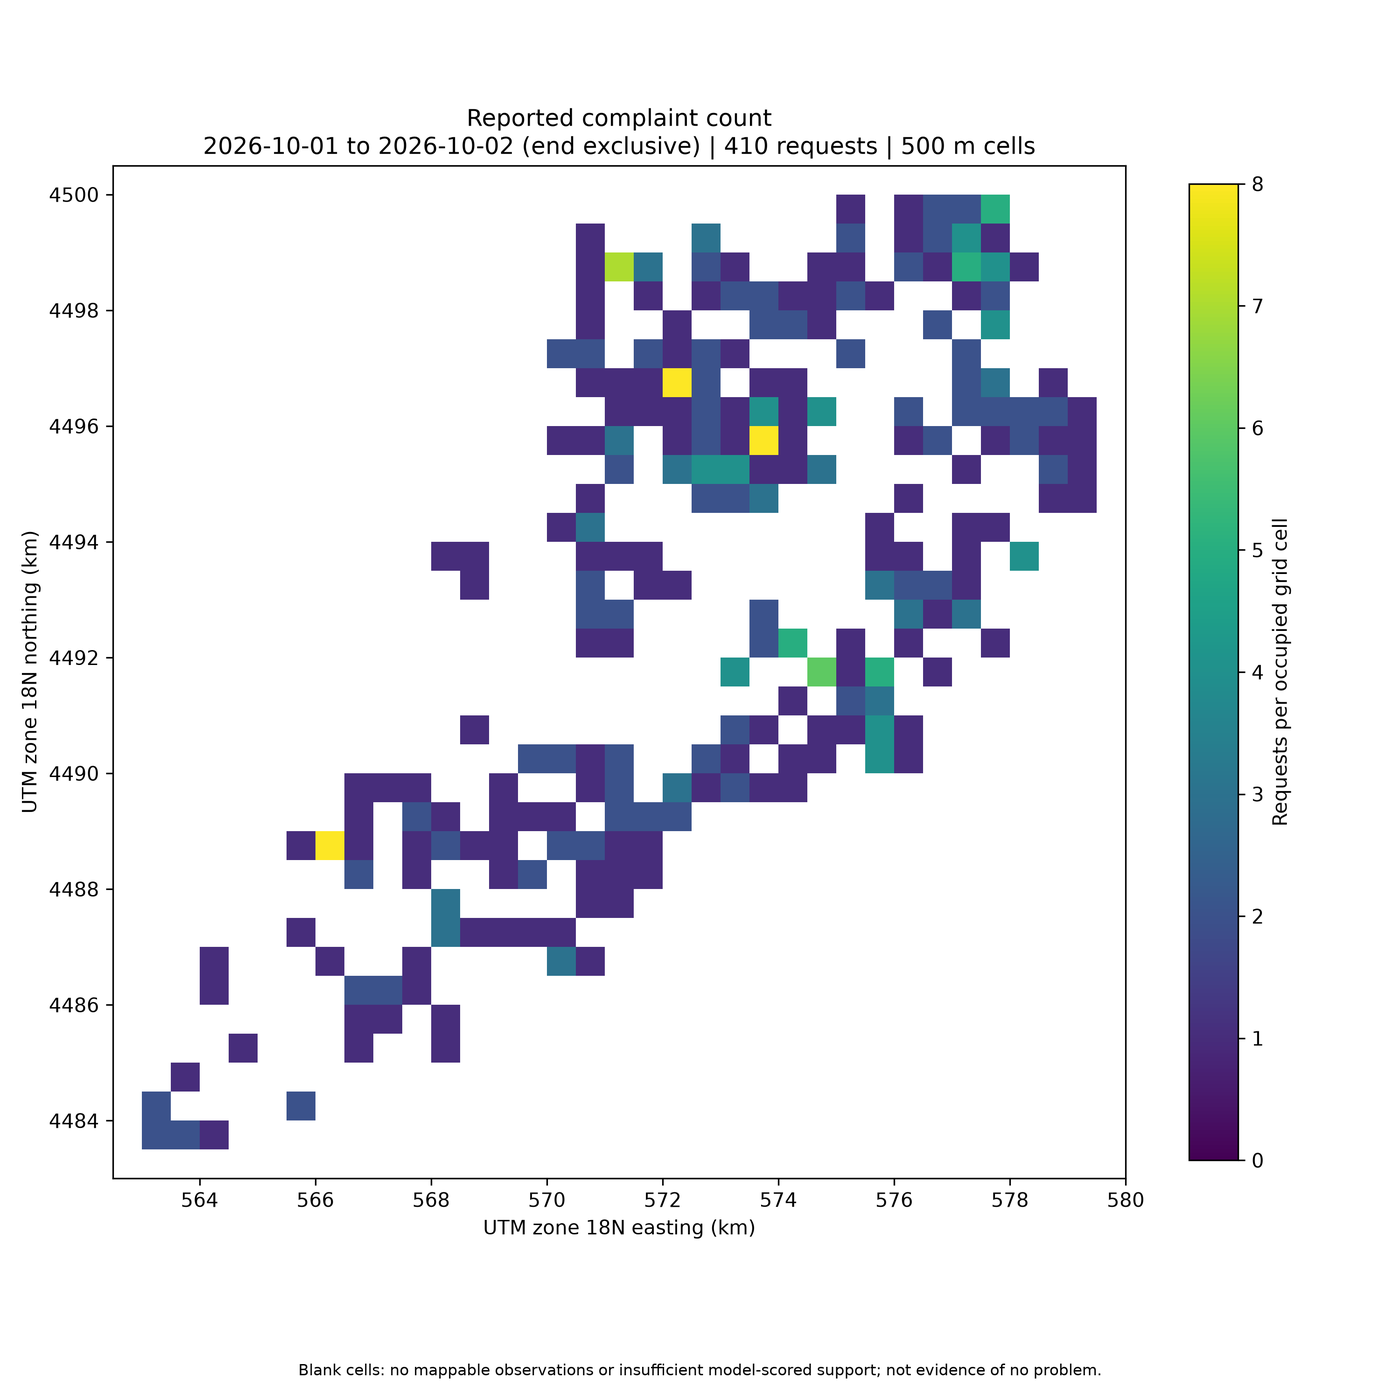
One bug turned up. Rendering the single-borough slice with --background-geojson squeezed the map into a corner, with the other boroughs’ labels floating in empty space. All five labels are always drawn, and those outside the data extent appear to throw off Matplotlib’s layout. The city-wide run is unaffected; the image above was rendered without the background. It is a small fix (skip labels outside the axes) that I have noted for the repository.
What 311 data can and cannot tell you
- Reporting is not incidence. A 311 record means someone reported something. Reporting rates can vary with awareness of 311, language, trust and access. A dense cell may have more reporters, not more problems.
- Counts are not normalized. The layers are not divided by population, housing units, road length or any exposure measure. A busy commercial cell and a quiet residential one are compared raw.
- Reports are unverified. The model rates the condition as described, not whether it existed or was fixed. A September 1 complaint should not be read as a hazard that is still present.
- Blank is not safe. Missing coordinates, sparse reporting and suppression all produce blank cells.
- Repeated descriptions are not independent evidence. 9,698 reports produced only 634 model judgments. A cell’s severity mean largely reflects its mix of complaint types, rated once each.
- Model confidence is not calibration. The ambiguity layer combines the model’s own confidence values and a variance term. It is not a probability of error.
The maps are useful for asking better questions, such as where volume is high but potential impact low, or where a few reports describe serious conditions. The README is explicit that they are not for emergency dispatch or decisions about individual residents.
Limitations
The project is a research demonstration with one published live run. Specifically:
- No labeled outcomes were used, so the accuracy, calibration and public-safety usefulness of the model scores are not established.
- The composite weights and display thresholds are illustrative choices, not validated parameters.
- Only one day of data has been scored and published. There is no longitudinal comparison, and volume normalization is relative to each slice.
- Testing covers Windows with Python 3.14; there is no platform or version matrix, and no CI configuration in the repository.
- Automated browser pan and zoom testing of the interactive maps has not been done. Those maps depend on external JavaScript, CSS and OpenStreetMap tiles.
- Upstream records can change between downloads. The stored hash documents a run; it does not guarantee a reproducible snapshot, and model responses can vary on rerun.
- Live scoring requires a TypeSafe API key and incurs usage charges. Reported token usage excludes failed or timed-out calls and is not a complete billing record.
- Single-borough PNG renders with the borough background have the label layout issue described above.
- The count layer shows single-report cells; there is no minimum-count suppression for it.
Resources
- CompleteTech-LLC-AI-Research/jev-311-heatmap – source-available on GitHub (no license file at this commit) – commit
172eae5
The data comes from NYC Open Data: 311 Service Requests from 2020 to Present. PNG backgrounds use the NYC Department of City Planning borough boundaries. Interactive basemap tiles are from OpenStreetMap contributors.
If you are working with public or operational data and want to test where a model adds signal, and how to keep its outputs typed, budgeted and auditable, that is the kind of work covered under AI-Driven Analytics.