
England Crime Atlas is a single-page interactive map of recorded crime in England, built entirely from open government data. It takes one month of Police.uk street-level records (July 2026), bins them into a 2 km grid, and draws that grid over an OpenStreetMap basemap. A second, deliberately separate view shows Ministry of Justice court outcomes for April 2025 to March 2026 by police force area, with the sex, age and ethnicity of convicted persons and the detailed Home Office offence codes behind each count.
I built it because public crime data is easy to download and surprisingly easy to misrepresent. The points are not where crimes happened, the counts are not rates, some forces are missing in any given month, and court statistics cannot be joined to individual incidents. I wanted a map that shows the geography without hiding any of that. This post covers the data sources and their licence terms, how the source data is anonymised, how I aggregate it, the rendering stack, and the limits of what the map can tell you.
Status: experimental. The repository publishes a single monthly snapshot with provenance receipts and a verification script; it is not a maintained service and should not be used for safety decisions.
Problem
Location anonymisation in the source data
The single most important fact about Police.uk coordinates is that they are not crime locations. According to the Police.uk About page, every crime is snapped to the nearest point on a master list of anonymous “map points”. Each map point sits over the centre of a street, a public place or commercial premises, and has a catchment that contains either at least eight postal addresses or none at all. Points with between one and seven addresses were removed from the list to protect privacy. If the nearest map point is more than 20 km away, the coordinates are zeroed out.
In practice this means crimes pile up on shared snap points, often a street centre or a landmark such as a supermarket or station, and the offset between the true location and the published point varies from street to street. A dot map of the raw coordinates invites people to read precision into the data that the publisher removed on purpose. That is the main reason the atlas never draws individual points.
The CSV files also carry an LSOA code for the area the anonymised point falls in. I use that code, not the coordinates, to decide what counts as England.
Solution
UX decisions
Most of the interface work went into making the caveats hard to miss without burying the map:
- The default view excludes ASB, which Police.uk publishes in the same files but which is not recorded crime. It can be added back as “Crime + anti-social behaviour”.
- Missing forces are named in the sidebar for that month, with the sentence “These gaps are not zero-crime areas.” In July 2026 there were no files for British Transport Police, Gloucestershire, Greater Manchester or North Yorkshire.
- A collapsible coverage panel lists per-force record counts, records without an LSOA, duplicates removed, and links to the Police.uk methodology, known data issues and the run receipt.
- Labels say “records” and “conviction occasions”, never “crimes per person” or “risk”.
- In the court view, unknown ethnicity is drawn as its own grey bar instead of being dropped, and the help text says the charts are separate margins that cannot be cross-tabulated.
Architecture
The data sources and their licences
Three public datasets feed the atlas, and each has its own attribution requirement:
- Police.uk street-level crime (data.police.uk): monthly CSV files per force, one row per recorded crime or anti-social behaviour (ASB) incident, with an anonymised longitude/latitude, an LSOA code (Lower Layer Super Output Area, a small census geography) and a crime category. Published under the Open Government Licence v3.0.
- MoJ Criminal Justice Statistics Quarterly, March 2026: the outcome-by-offence CSV archive (
obo_pros_conv_sent.csvinside it), also under the Open Government Licence v3.0. - ONS Police Force Areas, December 2024 (generalised, clipped boundaries): used for the court view. These carry the attribution “Contains OS data © Crown copyright and database right 2024; contains National Statistics data © Crown copyright and database right 2024.”
The basemap is © OpenStreetMap contributors and is fetched live from the OpenStreetMap tile servers, so it falls under the OSMF tile usage policy; no tile archive is bundled. The viewer loads Leaflet 1.9.4 (BSD 2-Clause) from unpkg.
The OGL is permissive, but it does require attribution, and the atlas carries it in three places: the map’s attribution control, a “Coverage & sources” panel inside the viewer, and a DATA_LICENSES.md file in the repository. That file also states plainly that these third-party statements “do not grant a separate licence for this repository’s application code”. There is no LICENSE file for the code itself. GitHub’s licence detector reports the repository as “Other”, but there is no open-source licence grant, so the code is source-available on GitHub, not open source.
Licensing also decided one thing I left out. The repository contains a local pilot that overlays publicly listed Bristol City Council CCTV positions on the crime grid. I could not find an explicit reuse licence on the council’s map layer, so the published viewer does not include that snapshot. The verification script enforces this: it fails if the embedded payload contains a cameras key.
The pipeline
The pipeline is three Python scripts and two dependencies (requests and pyproj). download_england_crime.py requests every force for one month from the Police.uk download form, waits for the archive to be generated, checks the ZIP, and writes a receipt containing the SHA-256, byte count, retrieval time and the licence. generate_england_crime.py refuses to run if the ZIP no longer matches its receipt, then streams every *-street.csv file out of the archive.
The rendering stack
The viewer is a single HTML template with no build step: Leaflet for the map, OpenStreetMap raster tiles, inline map code, and two small plain-JavaScript panel scripts (about 9 KB for the court view and 4 KB for the camera pilot) that are inlined at build time. The generator serialises the grid, category names, run metadata and court aggregates as one JSON object and substitutes it into the template, escaping </ so the payload cannot close the script tag early. The output is one static index.html you can serve from any directory.
Implementation
Aggregation: a fixed 2 km grid
For each row, generate_england_crime.py keeps only records whose LSOA code starts with E01 (English LSOAs), drops duplicate crime IDs per force, rejects coordinates outside a rough England bounding box, projects the point into British National Grid (EPSG:27700) and floors it into a cell:
# src/generate_england_crime.py
                lsoa = row['LSOA code']
                if not lsoa.startswith('E01'):
                    counts['non_england_or_missing_lsoa'] += 1
                    if not lsoa:
                        counts['missing_lsoa'] += 1
                    continue
...
                x, y = forward.transform(lon, lat)
                category = row['Crime type']
                cells[(math.floor(x / cell_m), math.floor(y / cell_m))][category] += 1
Working in British National Grid metres means every cell is a true 2 km square on the ground, rather than a lat/long rectangle that changes shape with latitude. Each occupied cell becomes a GeoJSON polygon (its four corners transformed back to WGS84) whose only property is an array of per-category counts. The cell size is a parameter, but the script refuses anything below 250 m. I put that floor in so the grid cannot be made fine enough to start resolving individual snap points.
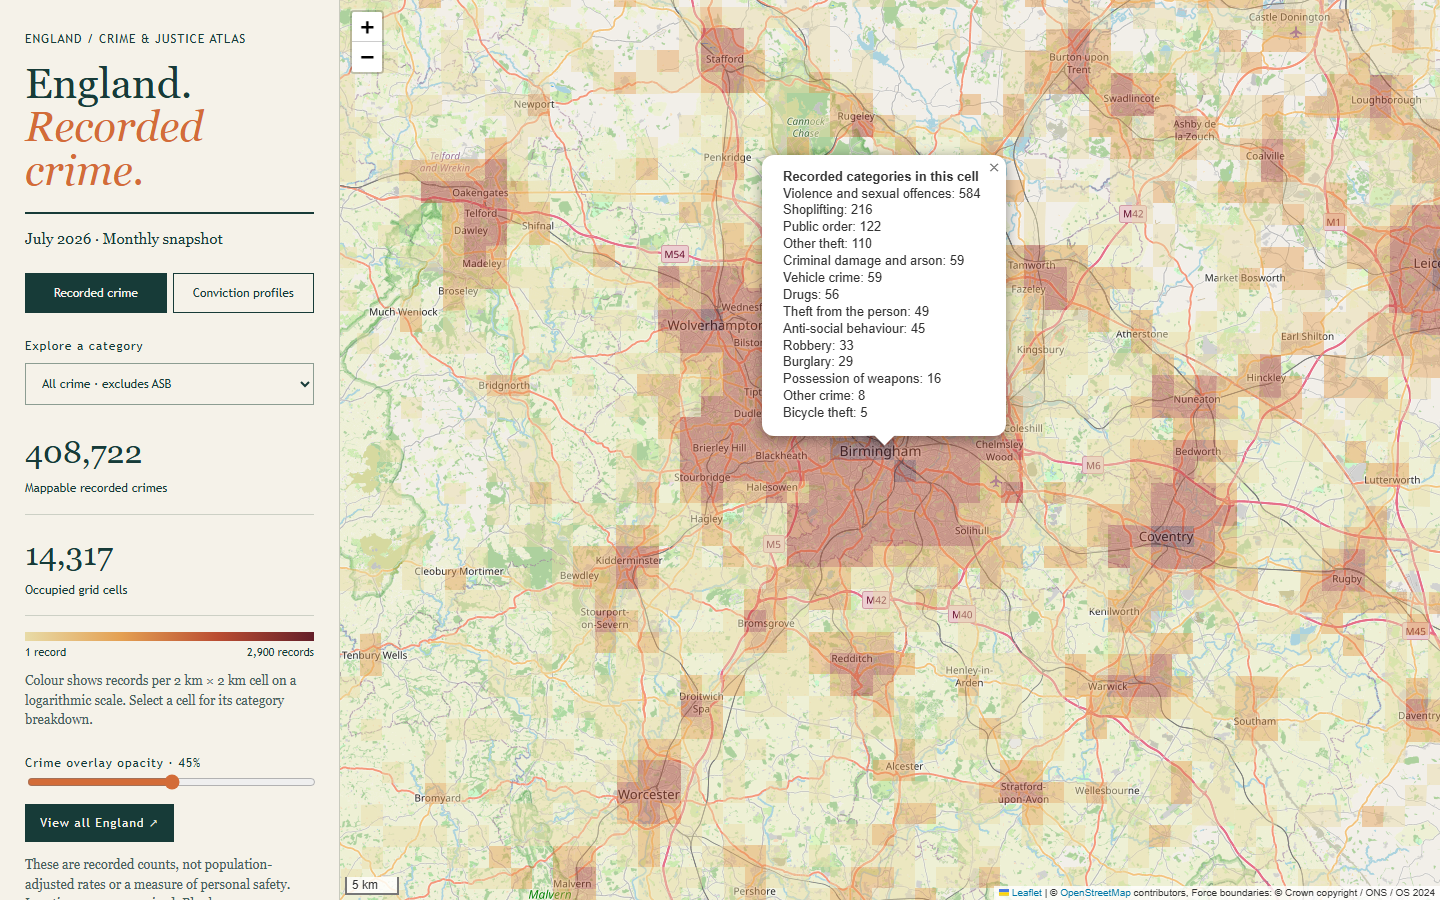
The run receipt records what happened to every source row. For July 2026 it shows 549,512 source rows; 52,344 were outside England or had no LSOA (21,287 had no LSOA at all); 825 duplicate crime IDs were removed; and 496,343 records were mapped into 14,986 occupied cells. Excluding ASB, that is 408,722 recorded crimes, and the default view shows them across 14,317 cells.
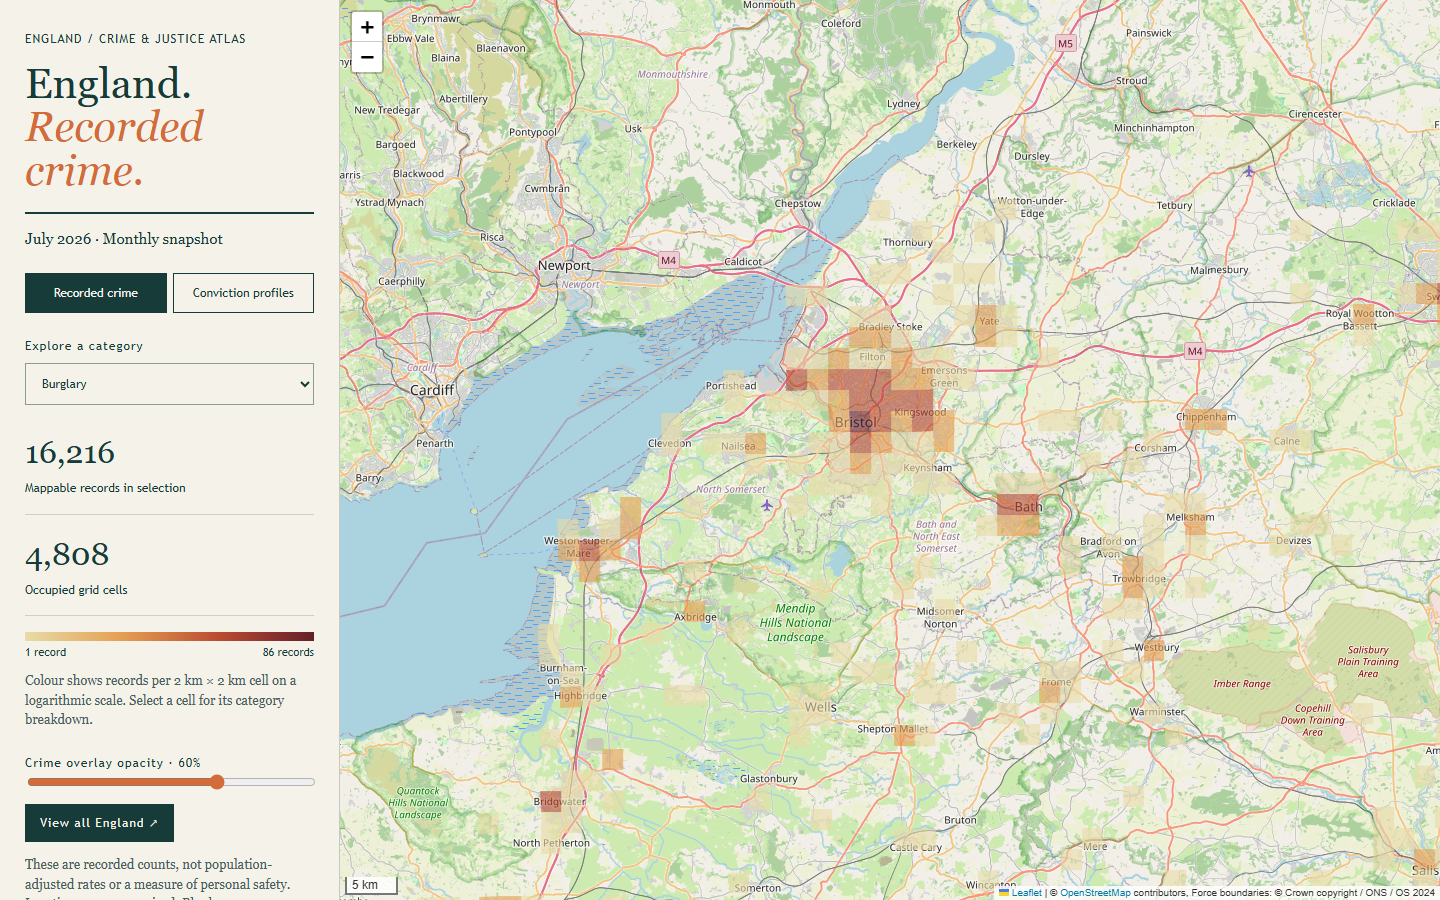
Because membership is decided by LSOA rather than by the cell outline, records reported by Welsh forces but located in English LSOAs are included, and cells along the border can extend into Wales. The Bristol screenshot below shows the other side of that rule: Cardiff and Newport are blank because Welsh records are excluded, not because nothing was recorded there.
Court outcomes, kept separate
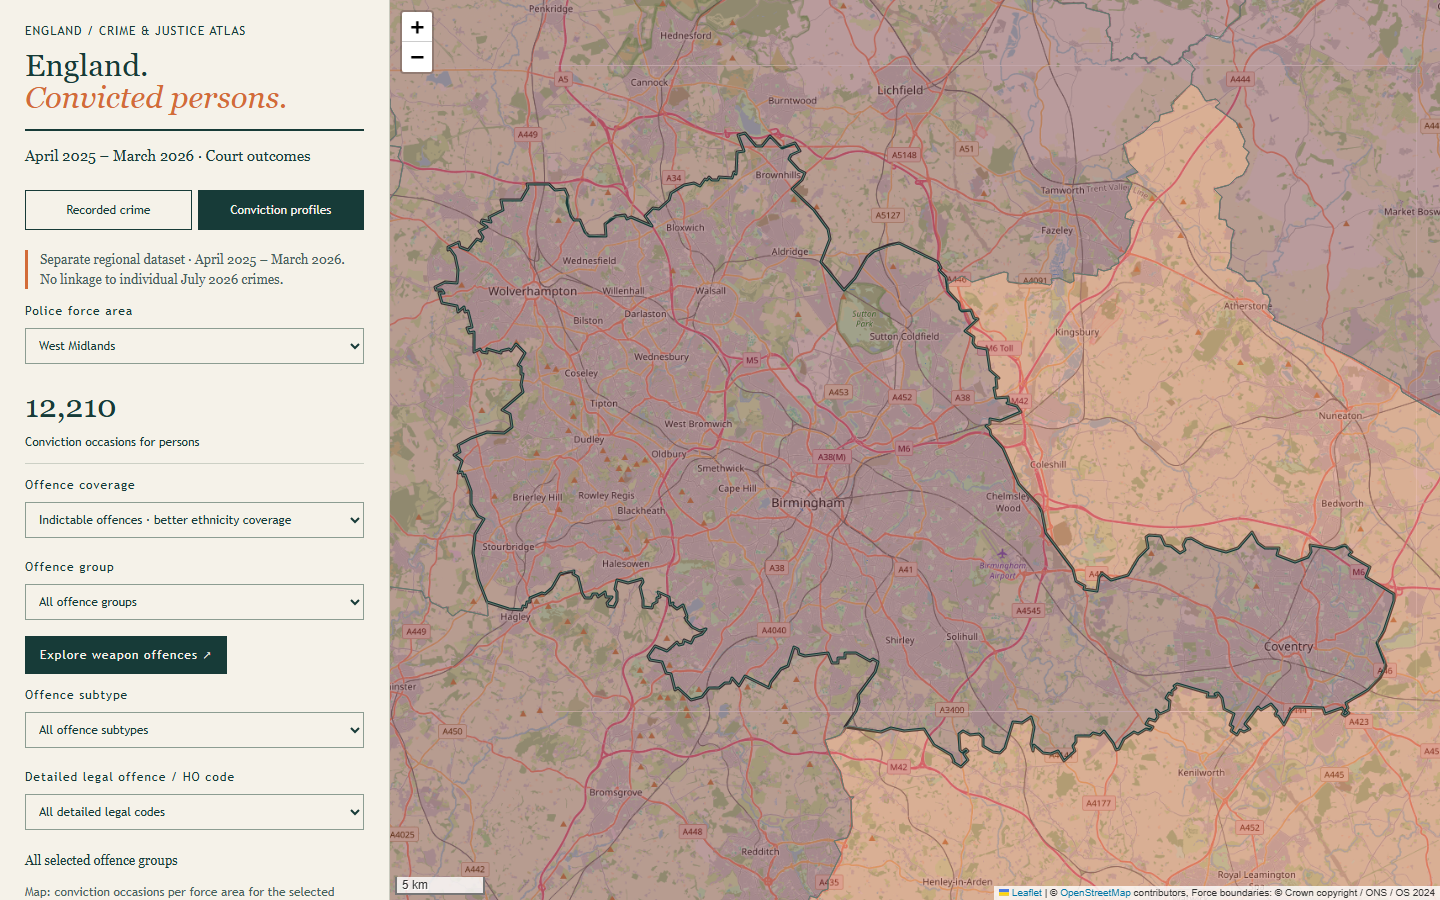
The second view answers a different question: what did courts conclude, and about whom, in each police force area? prepare_moj_enrichment.py reads the 4.1 million-row MoJ CSV, keeps the year ending March 2026, keeps only rows classified as persons (321,715 conviction occasions for companies, public bodies or unknown status are excluded), and drops Welsh force areas and “Not known”. It aggregates by force, offence group, offence and Home Office offence code, keeping sex, age, ethnicity, detailed ethnicity and quarter as separate marginal distributions. Unknown values stay in the denominator.
The two views share a page and a map, but never a join. The incident data is July 2026 by anonymised location; the court data is a year of completed proceedings by court-statistics geography, counted as conviction occasions (one person can appear several times). Dividing one by the other would produce a number that looks like a conviction rate and means nothing. The viewer says so in the panel, and the README puts it in a table at the top.
Joining MoJ rows to ONS boundaries is done by name, after stripping “Police” and “Constabulary” and applying a two-entry rename table. City of London has a boundary but no separate published profile in this extract, so it is shown as unavailable rather than as zero.
Colour scale
Colour uses a logarithmic scale with four bins, because cell counts span from one record to a few thousand in central London and a linear scale would leave almost everything in the palest colour:
# src/england_crime_map.html
style:f=>{const t=Math.log1p(value(f))/Math.log1p(max);return{color:'transparent',weight:0,fillColor:t<.25?'#e8dba7':t<.5?'#e4a052':t<.75?'#ba4d32':'#641f29',fillOpacity:Number(opacity.value)/100}}
The maximum is recomputed for each selection, so the scale always spans the chosen category: for burglary the darkest bin tops out at 86 records per cell, against 2,900 for all crime. That keeps a single category readable, but it also means colours are not comparable between categories, and the legend’s maximum changes to show it.
Performance
The committed page is about 11 MB. The crime grid is the smaller part (roughly 4 MB of GeoJSON for 14,986 cells); most of the weight is the court aggregates and simplified force boundaries. That is large for a web page but reasonable for a self-contained data viewer that needs no backend, no database and no API key.
A few choices keep it responsive:
- Leaflet is created with
preferCanvas: true, so roughly 15,000 polygons are drawn on a canvas rather than as 15,000 SVG elements. - Each render filters out cells with zero records for the selected category, so a narrow category draws far fewer shapes.
- Cells carry only a counts array, so switching category recomputes values in the browser without fetching anything.
- The opacity slider calls
setStyleon the existing layer instead of rebuilding it, so you can fade the overlay to read road names without redrawing.
I did not benchmark load or render times for this article, so I am not quoting numbers.
Evidence
The screenshots in this article and the verification run below were captured on 2026-10-21 from the committed snapshot at commit cb17819.
The repository does not have a unit test suite. Instead it has verification scripts. verify_moj_enrichment.py re-reads the raw MoJ CSV in an independent pass to reconcile area totals and weapon-code totals; it needs the 383 MB source archive, so I did not rerun it, and its committed result file records a pass. verify_published_map.py needs only the committed output and is what GitHub Actions runs on every push, along with Python and JavaScript syntax checks. Among other things it checks that no cell carries anything other than counts:
# src/verify_published_map.py
    for feature in features:
        assert set(feature['properties']) == {'counts'}, 'Unexpected incident-level attributes'
        assert len(feature['properties']['counts']) == len(names)
        for name, count in zip(names, feature['properties']['counts']):
            assert isinstance(count, int) and count >= 0
            category_totals[name] += count
    assert dict(category_totals) == metadata['category_counts']
I ran it locally against the committed snapshot for this article. It passed and reported 408,722 recorded crimes, 38 English force profiles, 820,587 person conviction occasions (214,584 in the indictable view), 40 weapon codes and 60,190 demographic margins, all matching the published metadata. The CI syntax checks also passed locally. These checks prove the published file is internally consistent with its receipts; they do not prove the source data is complete or representative.
Limitations
The atlas is an experimental, single-snapshot project. It shows one month of police data and one year of court data, both retrieved on 30 September 2026, and nothing refreshes automatically. Limitations to keep in mind before quoting anything from it:
- Recorded crime is not crime. The map shows what police recorded and published, which depends on reporting behaviour, recording practice and force data quality. Police.uk notes that crimes can be reclassified in later months and that later changes may never reach the published files unless a force refreshes its data.
- Locations are anonymised offsets. Every record is snapped to a shared map point. At 2 km that effect is mostly absorbed, but a cell boundary can still split or merge a busy snap point, so neighbouring cells should not be compared too finely.
- Counts are not rates. Nothing is adjusted for resident population, footfall or commuting. City centres and retail areas can look dark simply because of how many people pass through them.
- Missing data is not zero. Four English or transport forces had no July 2026 files, and 21,287 source rows had no LSOA and could not be placed.
- Boundaries change. England membership depends on whichever LSOA version Police.uk used for that month, and the court view uses the ONS December 2024 force-area boundaries. The fixed British National Grid cells are stable over time, but the tool does not handle boundary revisions or compare months; force-area names are matched to MoJ names by a small hand-written mapping that would need checking for a new release.
- No linkage between the two views. Court demographics describe convicted persons in a force area’s statistics. They cannot be attributed to grid cells, neighbourhoods or individual crimes, and the periods differ.
- Rebuilds are not byte-identical. Publishers can revise downloads, so the SHA-256 receipts identify what was used, not what you will get next time.
- Third-party runtime dependencies. The viewer needs live access to unpkg for Leaflet and OpenStreetMap for tiles, under OSM’s tile usage policy. It is not suitable for heavy traffic without a different tile source.
- The Bristol CCTV overlay is local only pending licence clarification, and even locally it shows listed positions, not camera coverage.
Resources
- CompleteTech-LLC-AI-Research/england-crime-atlas: source-available on GitHub, no open-source licence for the code (GitHub shows “Other”;
DATA_LICENSES.mdcovers third-party data only), commitcb17819.
Data attribution: contains public sector information from Police.uk and the Ministry of Justice licensed under the Open Government Licence v3.0. Police force area boundaries: contains OS data © Crown copyright and database right 2024; contains National Statistics data © Crown copyright and database right 2024. Basemap in screenshots © OpenStreetMap contributors, rendered with Leaflet.
If you are working with public or internal datasets and need maps or dashboards that keep their provenance and caveats attached, that is the kind of work covered by our AI-Driven Analytics service.
The atlas is a project of CompleteTech LLC AI Research; all commits in the repository at this snapshot are by Timothy Wayne Gregg.